
Box Plot, Candle Stick, and Waterfall Charts in Looker Studio Explained *with pics
Complex charts like Box plot, Candle Stick, & Waterfall require a little bit of preparation to build reliable & useful reports. This is how we do this.
This is as close to #hacks that we fly. These are quick bite-sized tips for the Looker Studio Professionals to level up your skills and grab that last 10% of GDS functionality without having to spend hours failing again and again… #BeenThere

Complex charts like Box plot, Candle Stick, & Waterfall require a little bit of preparation to build reliable & useful reports. This is how we do this.

You will need a database or buffer between your Looker Studio report & the GA4 destination. This might be a cached connector, BigQuery (warehouse), Google Sheets, or Extract Data. But the normal connector is pretty much useless.

Learn how to recreate missing GA4 dimensions and metrics through the use of Looker Studio’s calculated fields!

Google Data Studio is now Looker Studio!! Learn how to migrate data alongside a domain name change.

We have complied a list of some of the best Looker Studio templates on the internet to get you starting on creating amazing and actionable visualizations.

Learn how to create your very own custom SEO research tool using Answer the Public, Google Sheets, and Looker Studio.

This article will cover how to track affiliate and outbound traffic by monitoring link clicks. We will measure traffic and engagement with these links, visualize and display this data clearly and concisely, and provide a logical path to action.

Learn how to create custom navigation in Looker Studio that will make your reports stand out.

Learn how to use Looker Studio’s URL parameters to generate unique reports. This video uses the example of country-specific reports.
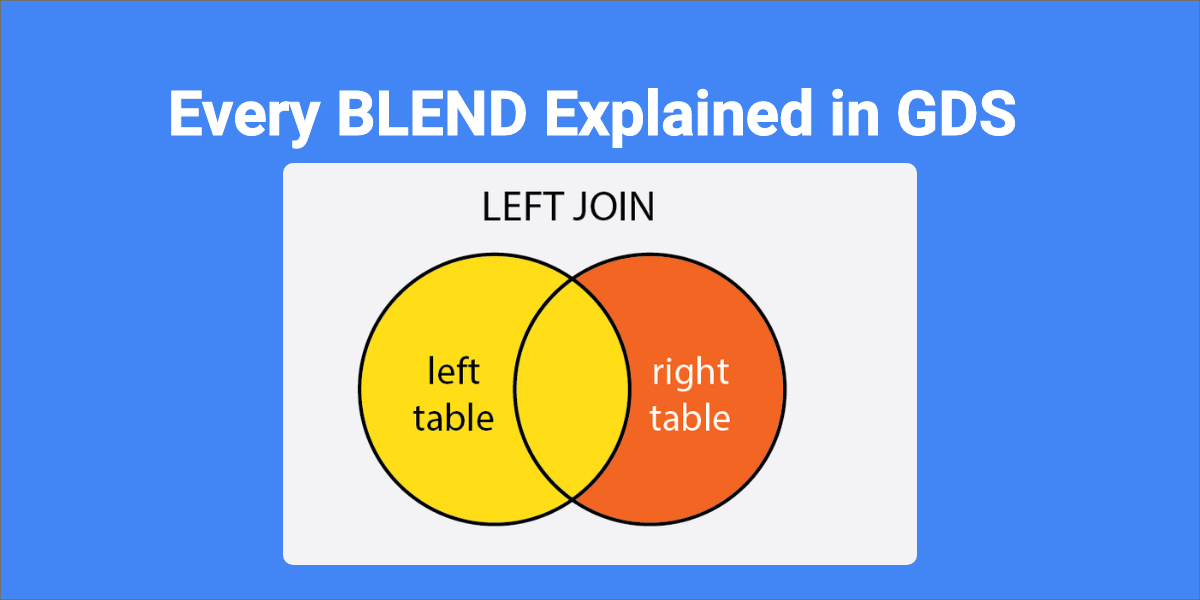
Blending In Looker Studio takes two to five Data Sources and combines them using a field or fields to link them together. How you would like to deal with “Missing” data is how you will determine your Blending mode.
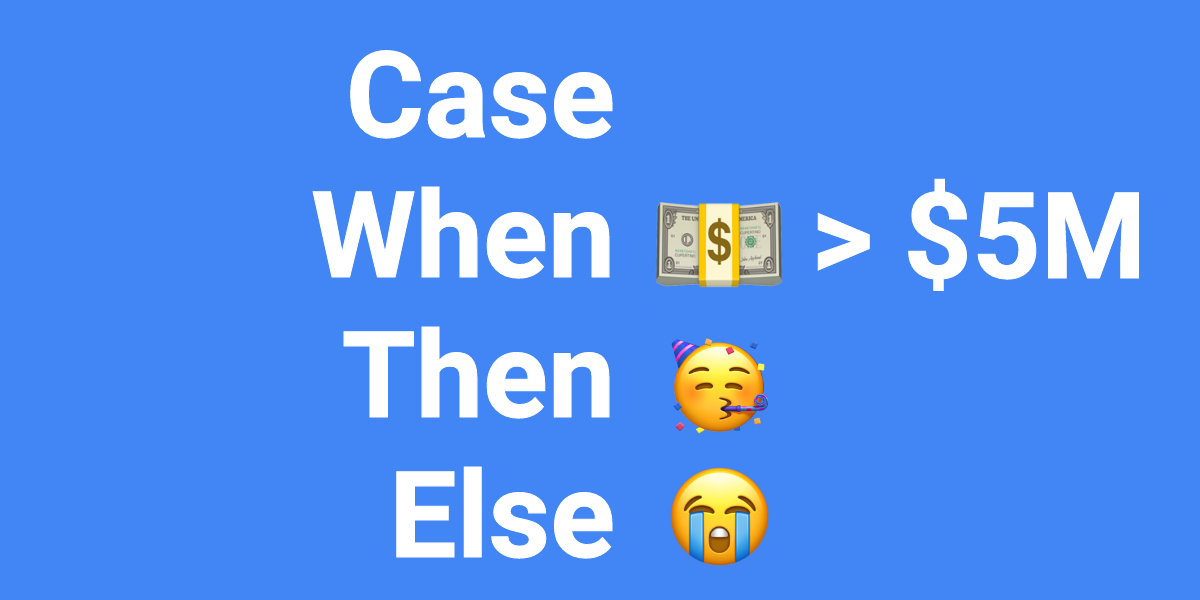
I am going to keep this ULTRA ACTIONABLE for you, using examples that you can copy & paste without too much effort. However, for the casual Looker Studio User, you might stop halfway through this article and circle back at a different time.

Manifest Paths allow for Looker Studio users to build custom data visualizations for internal use or share them with the world. You can make anything your mind & developer can dream of with a custom visualization manifest path.
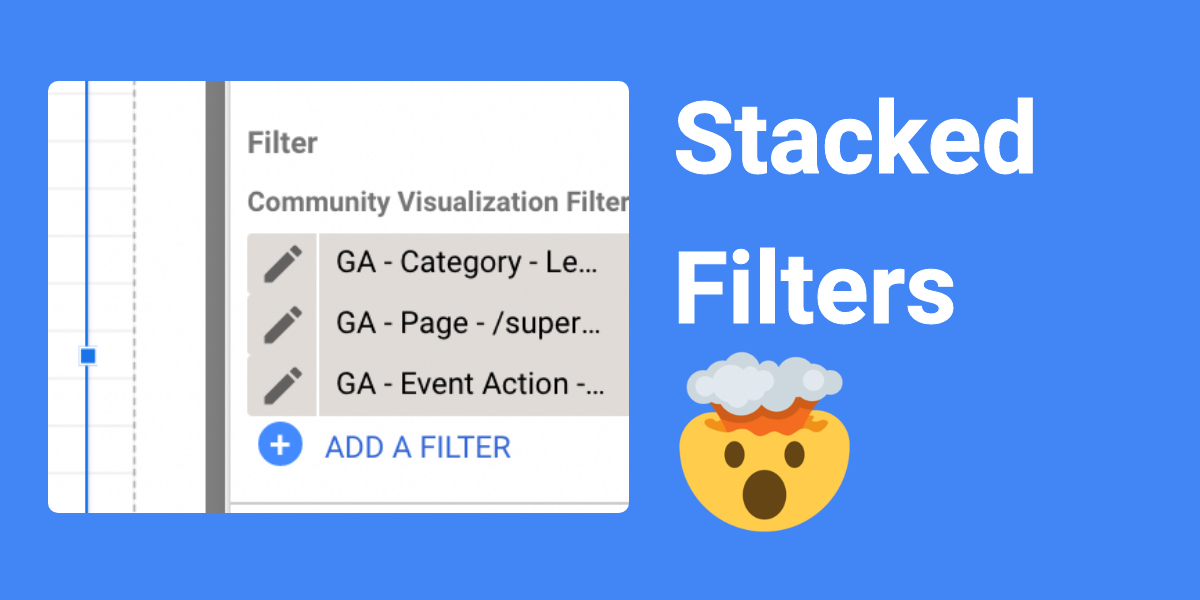
Looker Studio filters are a way to display only the good information you want and eliminate the rest without having to pull your hair out. If you follow these tips, you will be good to go!

Regex is a language used to find patterns from strings of text or numbers. You can use Regex within Looker Studio to uncover and clean any piece of information. From a simple string of text to complicated patterns, Regex can handle it.
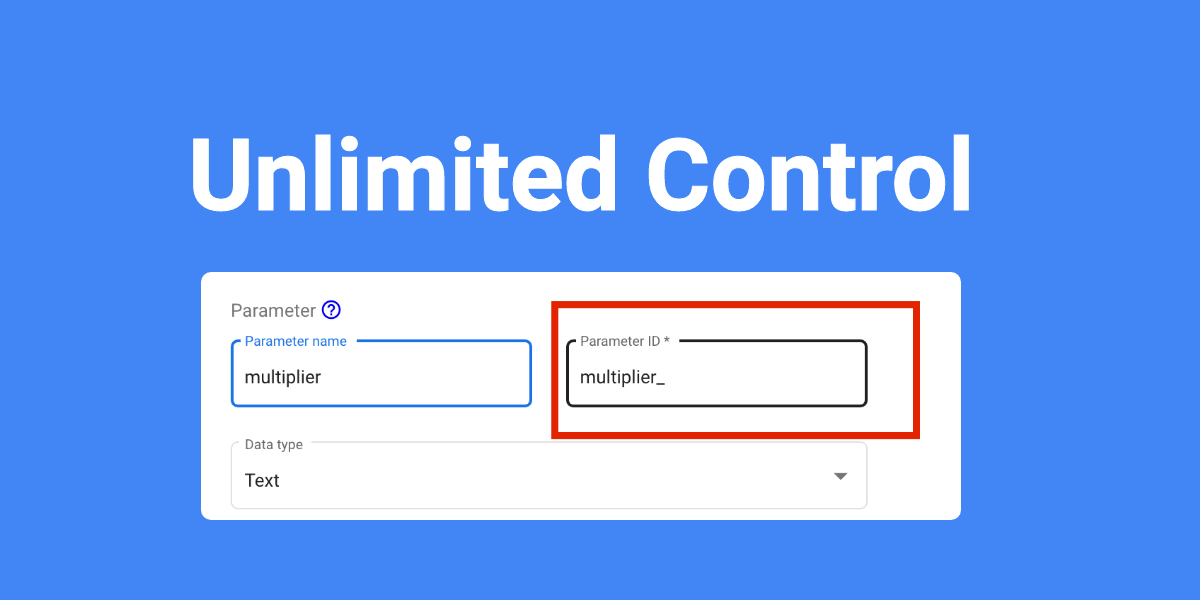
Use these field IDs to control multiple data sources with a single filter/control. This cuts down on data manipulation time (blending, querying, etc)
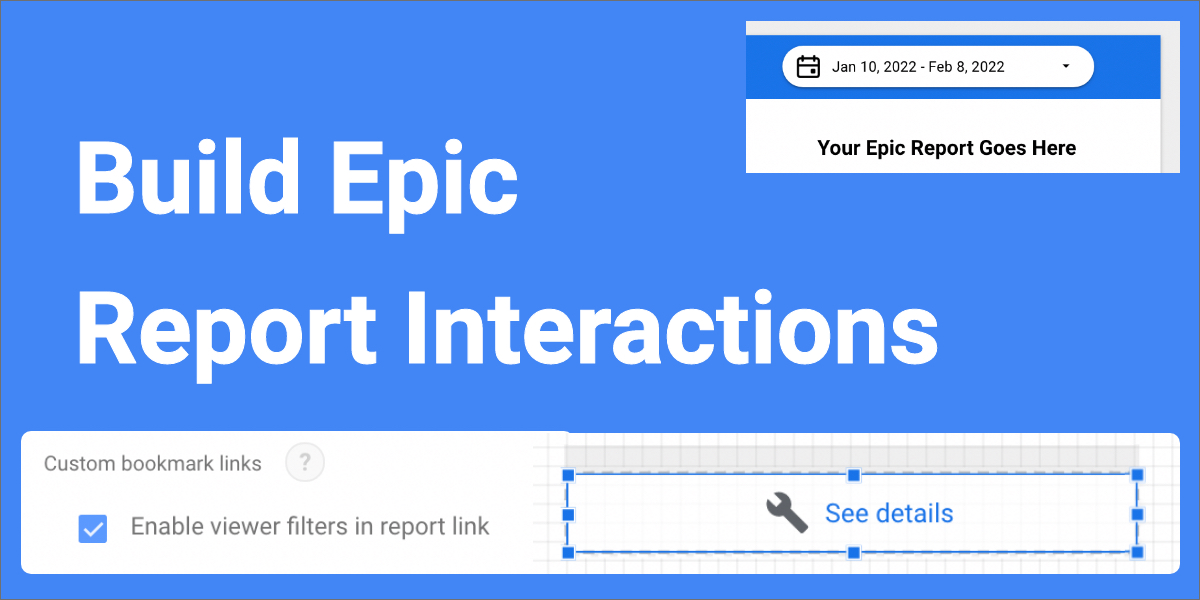
Looker Studio Controls are what differentiate a presentation from a dashboard. Give users unlimited ability to drill into your data faster than ever before. No Code Required!

Yes GDS has shortcuts & they are amazing! Using Looker Studio’s hidden shortcuts allow you to work faster, stay focused, stop relying on your mouse to get things done. I use 80% of the shortcuts every day!
LEARN & CONNECT
WATCH
BUILD
LEARN
WATCH
BUILD
CONTACT