Are your dashboard and data visualizations missing something? Do they serve their purpose but fall short when it comes to user interface design? Do you want to impress clients with eye-catching and seamless dashboard navigation?
If you answered yes to any of the above questions, you’ve come to the right place!
When creating share-worthy reports, using custom navigation allows you to step up your design game, generate a seamless flow from page to page, and easily distinguish what content exists on which pages! Custom navigation will put you at the cutting-edge of data visualization and make your reports stand out from the rest.
This article is your step-by-step guide to creating attractive and accessible navigation side-bars in Looker Studio that are entirely customizable and sure to impress.
Let’s get right into it!
Basic Formatting
Step 1: Build the Foundation
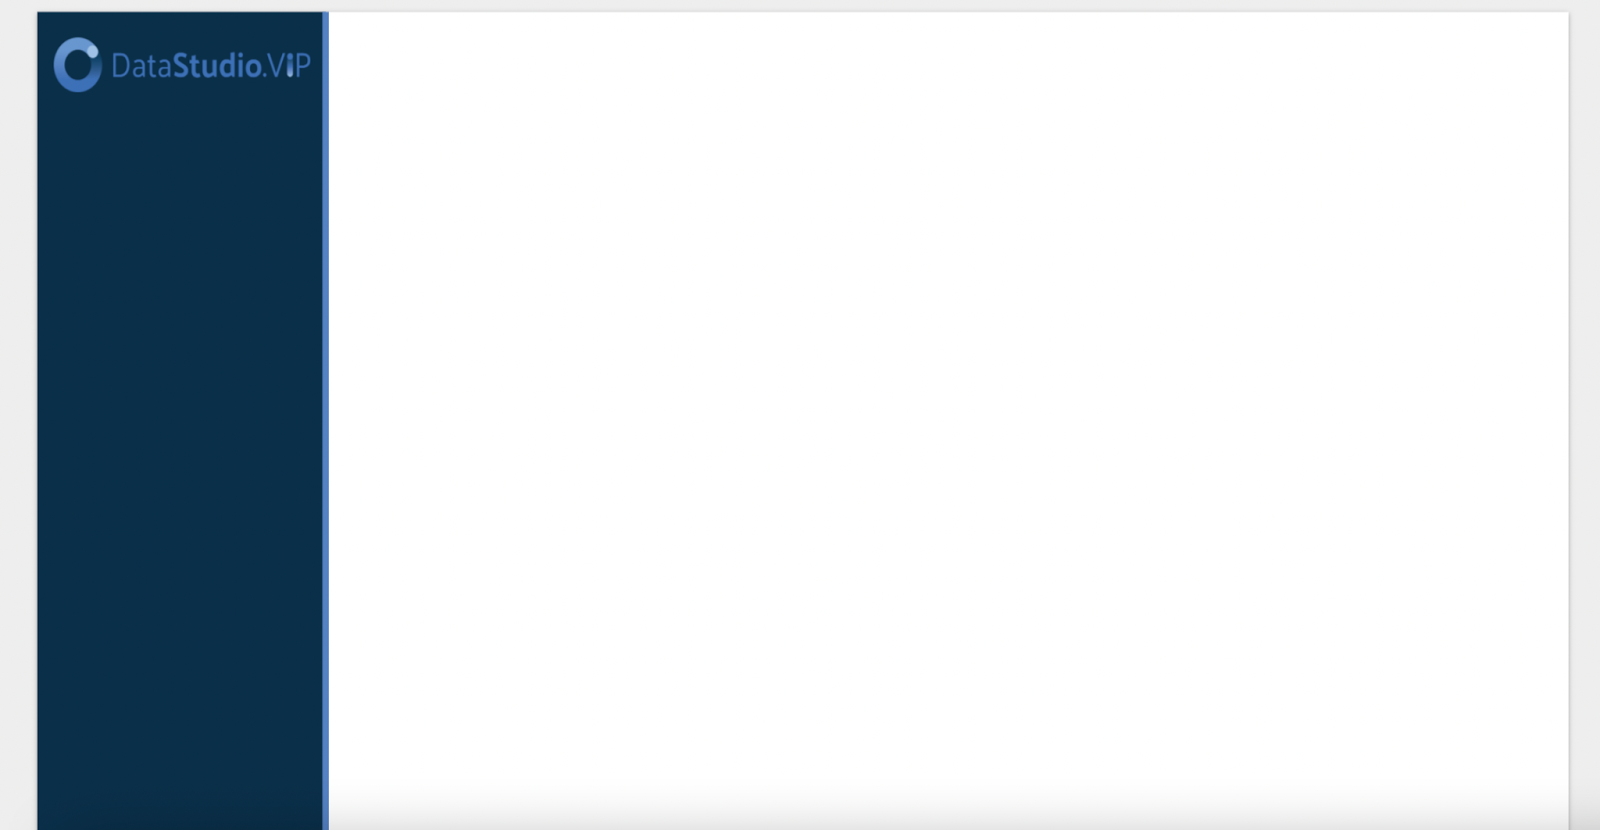
Once your data source is connected, you have complete access to all that Looker Studio offers. I know just how intimidating that blank white page can be, but building a navigation bar is a great way to get started and organize your report.

The first step is as simple as it gets! We have to build the base of our sidebar using the shape tool. Select the rectangle tool and place it over the length of the left side of your report, about an inch and a half thick.
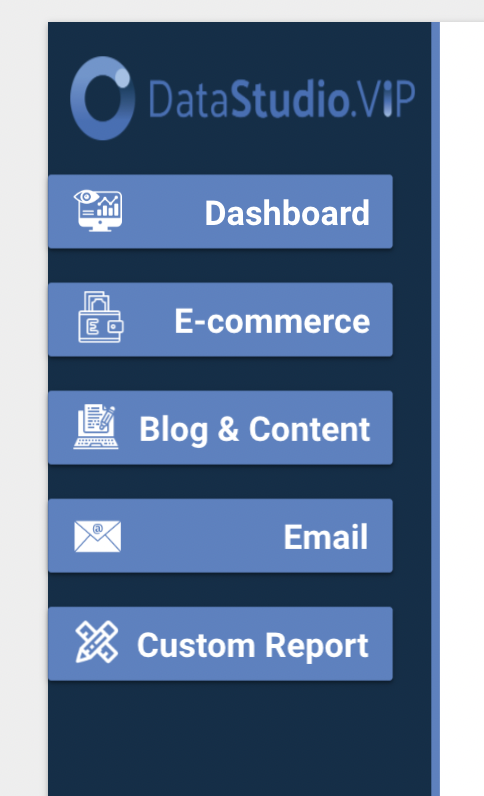
When we build out visualizations for our clients, we like to customize them to fit their unique branding. You can achieve this by using the client’s color palette and fonts (or similar font). As the cherry on top, we like to include the client’s logo at the top of the navigation bar.
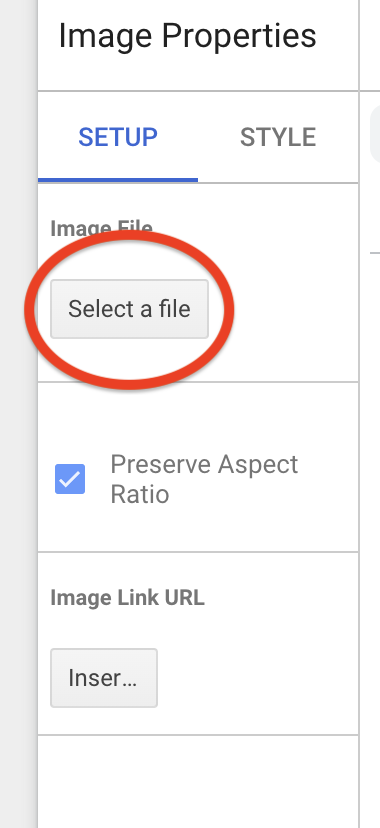
In the toolbar, under “Insert,” select image and drag, and click on the main page. A section called “Image Properties” will pop up on the right side. Click “Select a file” and import your or your client’s logo.
Step 2: Page Tabs
Next, we will make tabs for the individual pages of the report.
Once again, using the rectangle tool, we create 5 tabs on our original rectangle that will serve as navigation buttons that will take us to each section of the report.
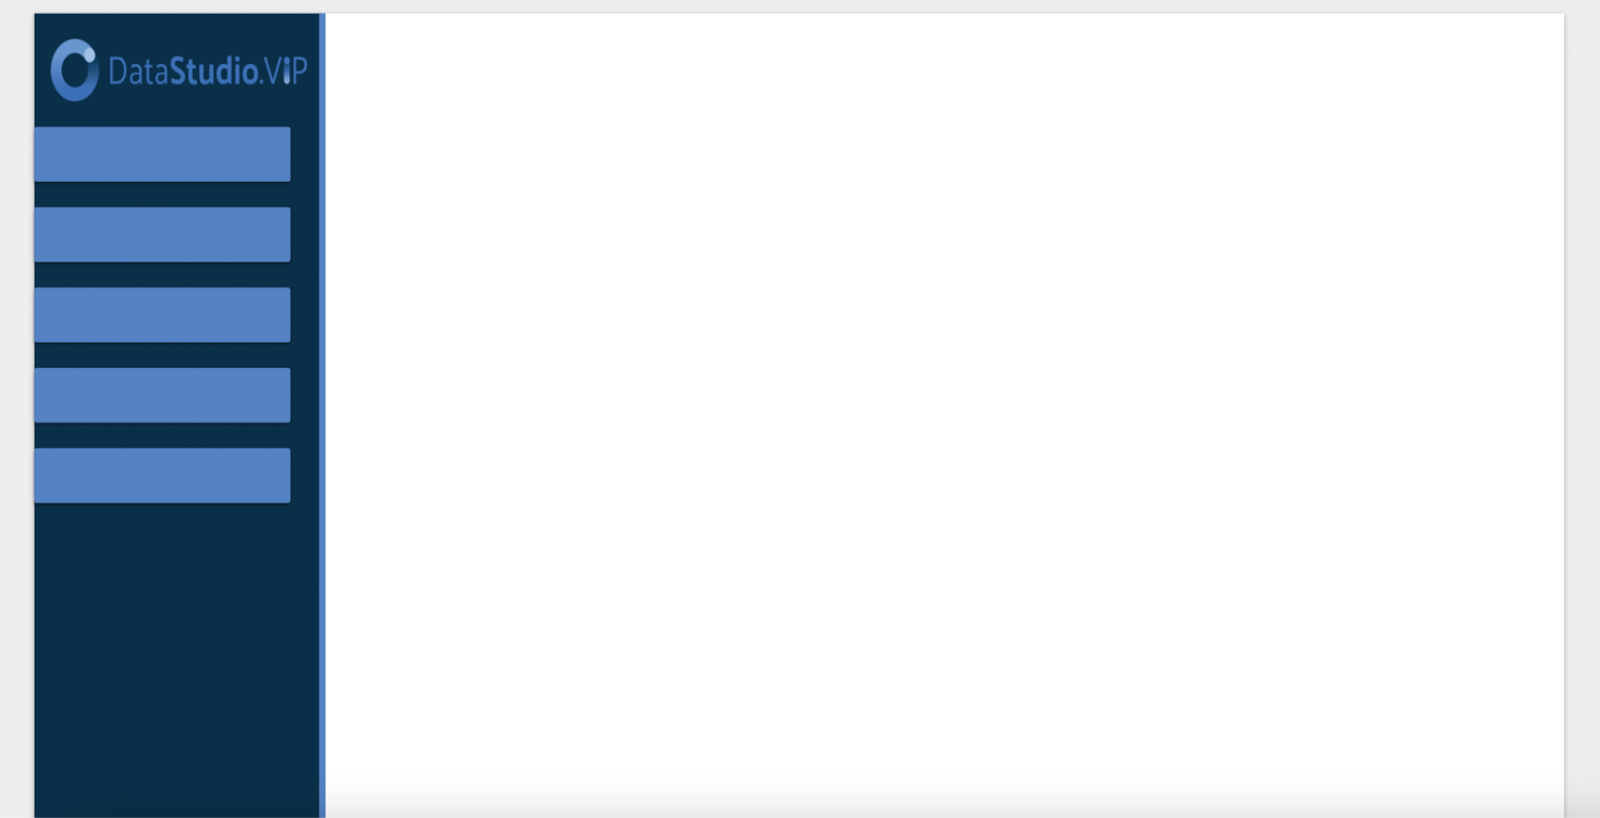
I like to format these tabs with a border shadow, which you can find under the style tab, as it makes the buttons pop off the page a bit more!
On top of each of these tabs, insert a text box containing the name of each page you wish to create.
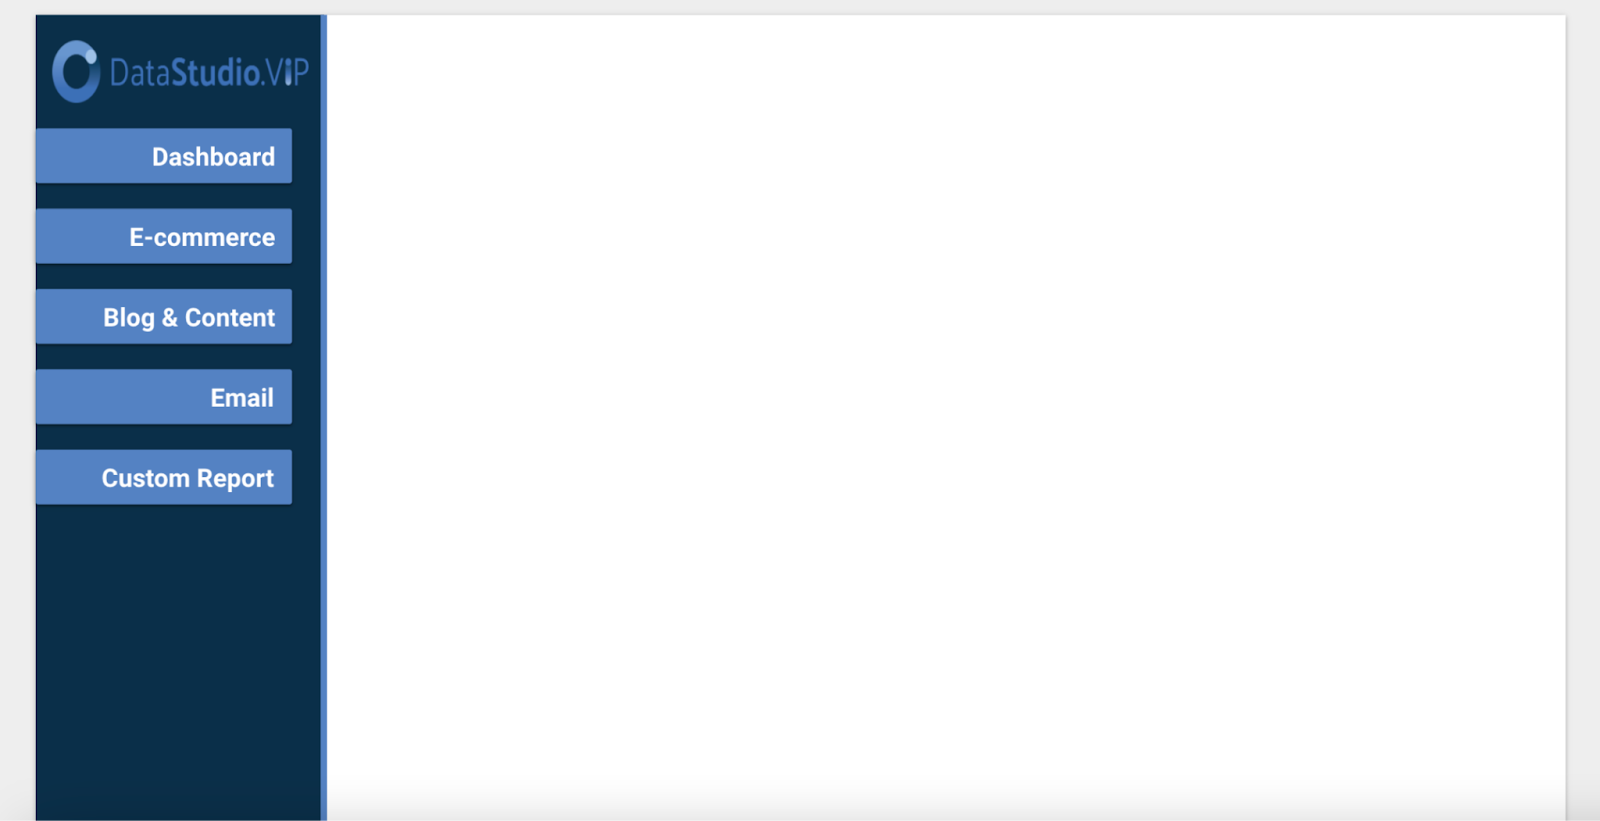
The titles we have here are just to serve as an example. You can create pages for any content you might dream up!
FREE Template To Get You Started
Open This Link, make a copy, & you are off to the races!
Step 3: Get Fancy with Icons ✳️🅿️🚼🛄🆒(Optional)
This next step is purely for design purposes and is entirely optional. But, if you want to dress up your report a bit, including related icons on the tabs is a great way to really go above and beyond.
Icons8 is an excellent resource for this because you can customize the color of all their icons for free, and you can find an icon for just about anything you could need!
The best part about all the steps we’ve gone over so far is that they are all entirely customizable. The examples we provide here are simple and tailored to our brand, but you have complete creative freedom to design this navigation bar however you want. You can use all neon colors and star-shaped buttons if that’s what your heart desires (Though we’d urge you to mayyybeee reconsider that choice 😉)!
Have fun and experiment with the design elements and really give your reports that WOW factor!

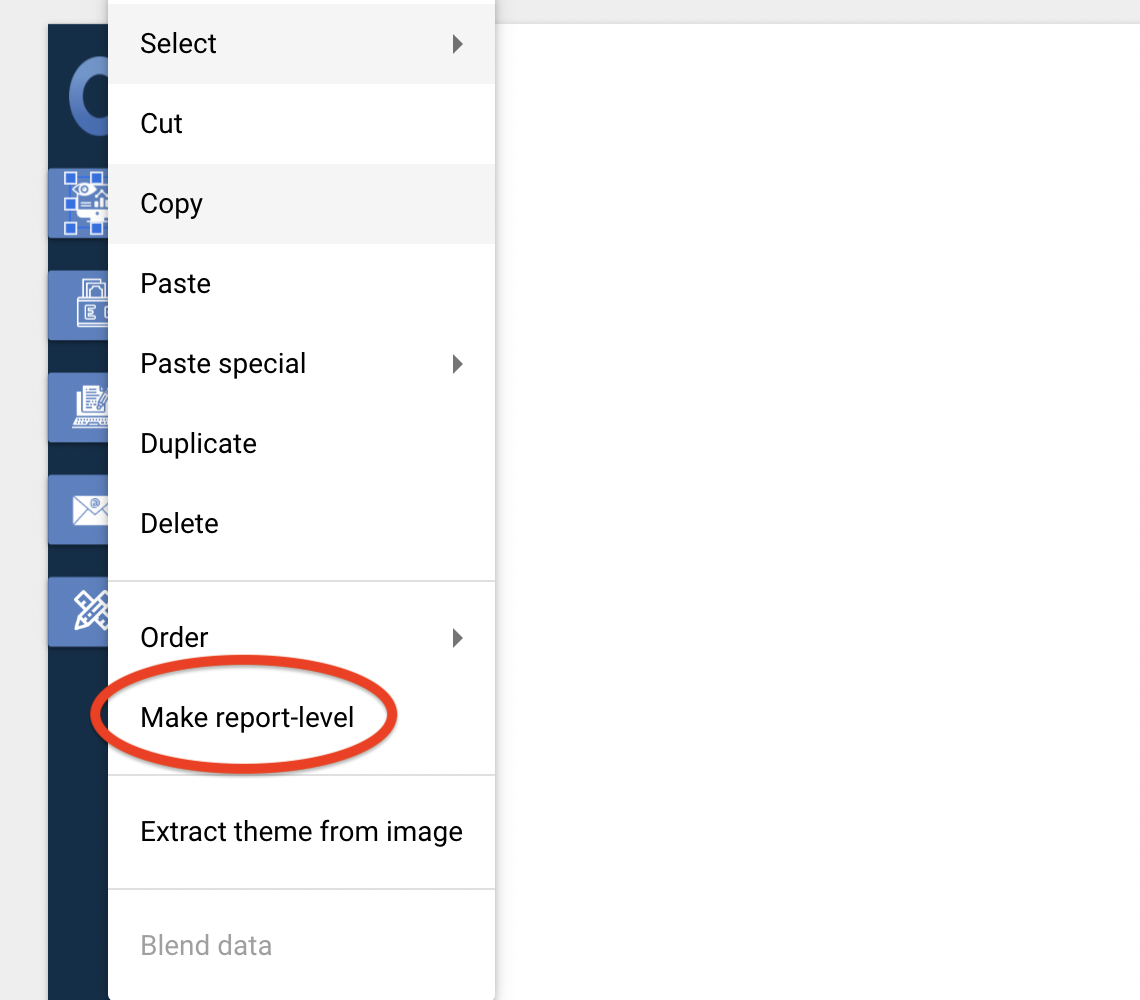
Step 4: Make Report-Level
This last step is simple yet crucial as it will make your navigation bar appear on every report page.
Drag and select all the components on the page and right-click on them. A menu will appear. Select “Make Report Level.” It’s that simple! Now your nav bar will appear on all pages of the report!
Making the Navigation Bar Interactive
Once all the design elements of the navigation bar are set up, we need to make it functional!
Step 1: Insert Images Over Tabs
Under the “Insert” tab in the toolbar, scroll down and select “Image.”
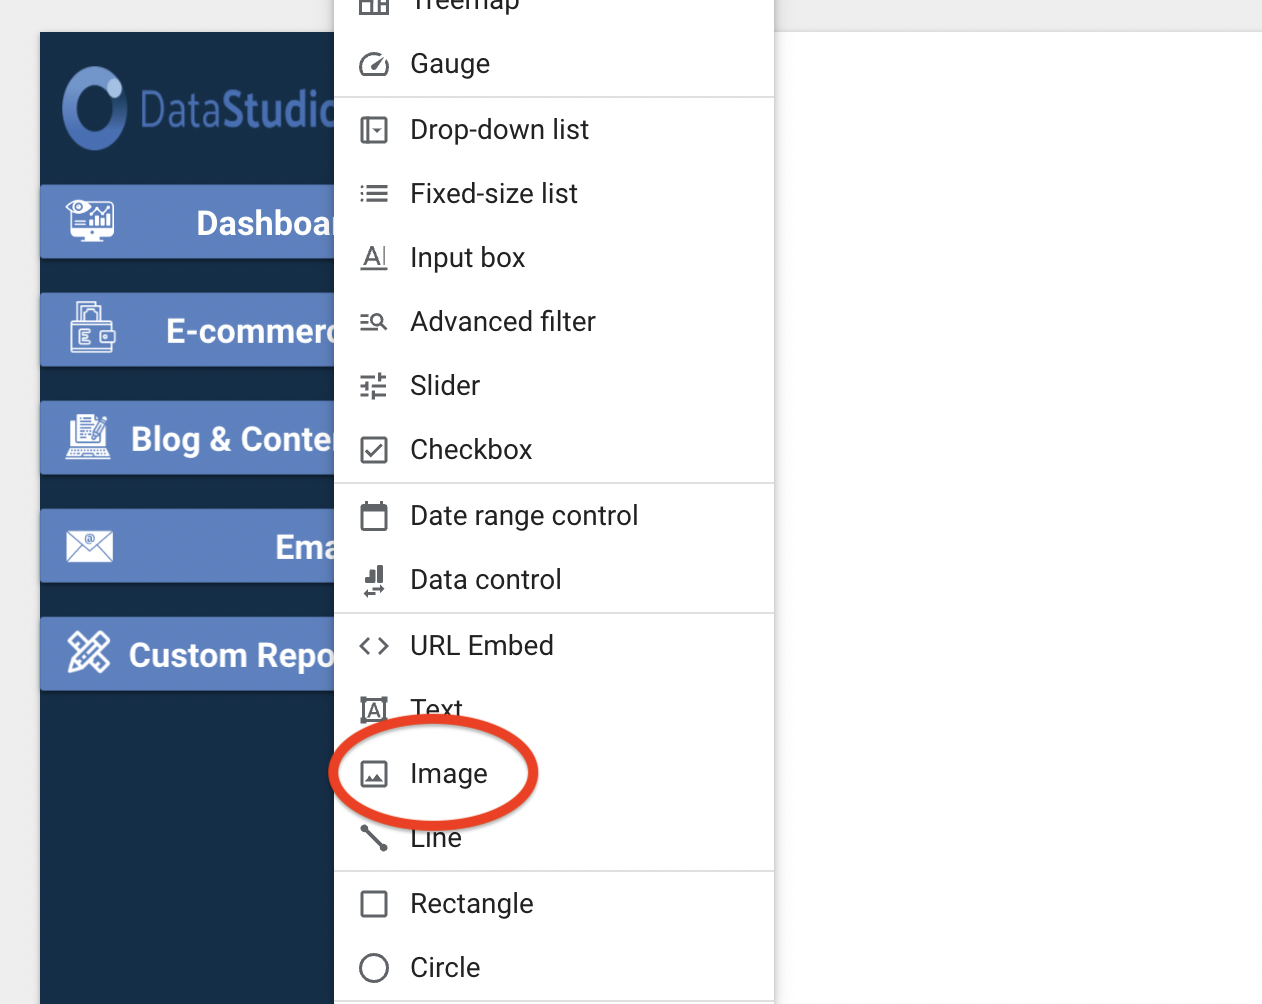
Once you have selected this, take your mouse and drag the shape over the first tab in your navigation bar.
You do not need to “select a file” or add any actual image here; we just want to utilize the “Insert Link” function of the image.
Step 2: Link Image to Pages
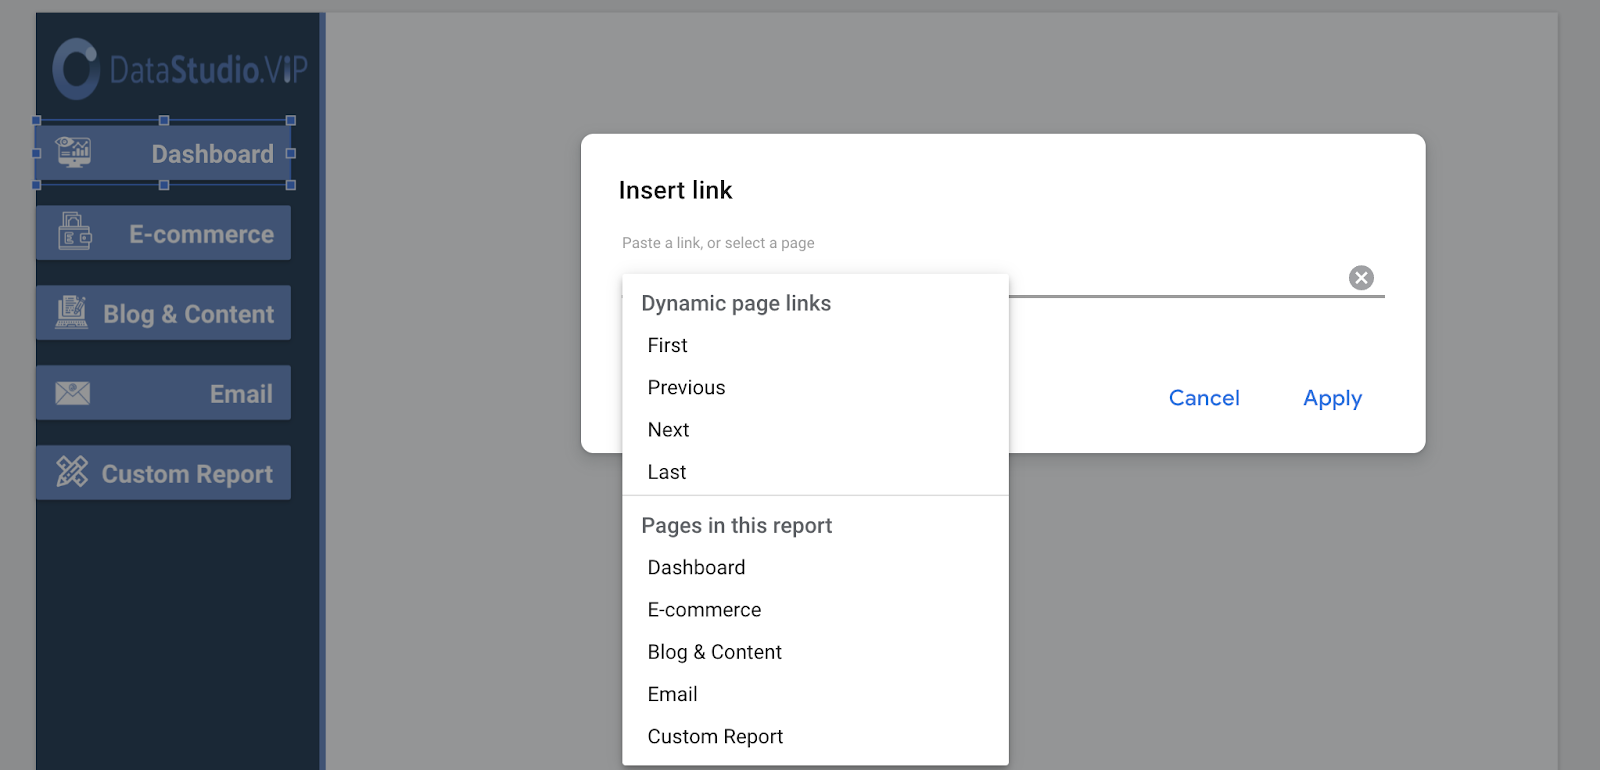
Under “Image Properties,” select “Image Link URL.”
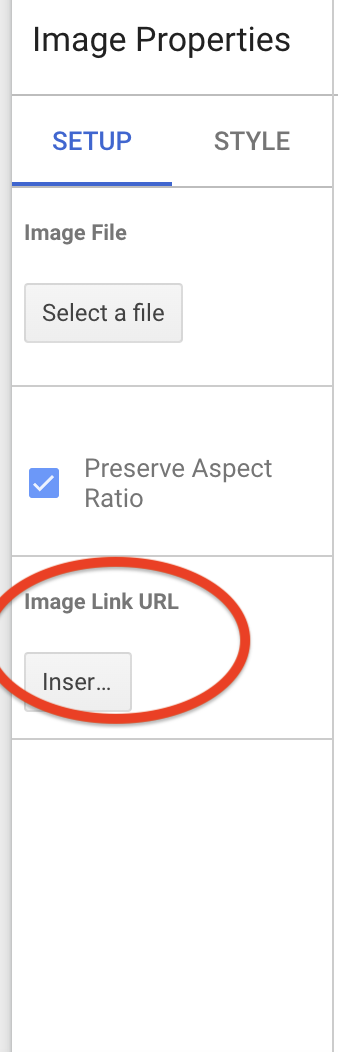
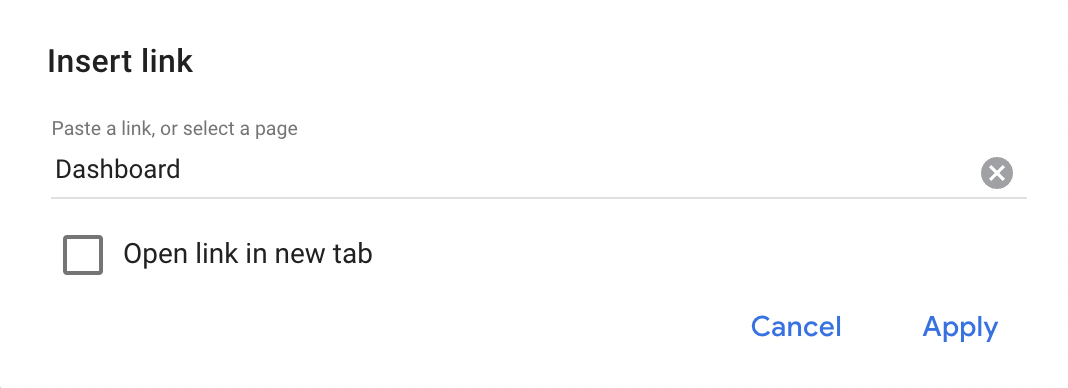
You will then want to click into the field and select the page that corresponds to the specific tab.
Make sure that once you’ve done this, you unselect “Open link in new tab,” or you will create a new tab every time you navigate to a different page of your report.
Once the image is linked to the page, right-click and make it report-level.
Repeat this process for all your tabs until you’ve created functional buttons for each page of your report.
You can check your work by switching the report to view mode and clicking on each of the tabs. You will know it is working if it takes you directly to the desired page.
Step 3: Highlighting Current Page (Optional)
Once all the tabs are fully functional, the final cherry on top is distinguishing the current page by highlighting the corresponding tab in the navigation bar.
You will need to create another rectangle with the shape tool directly over each tab to achieve this. These rectangles are all page-level, so make sure to place them over the tabs on the page they are connected to.
In the style tab, set the background color to transparent, then select a border color and border weight that fits your design.
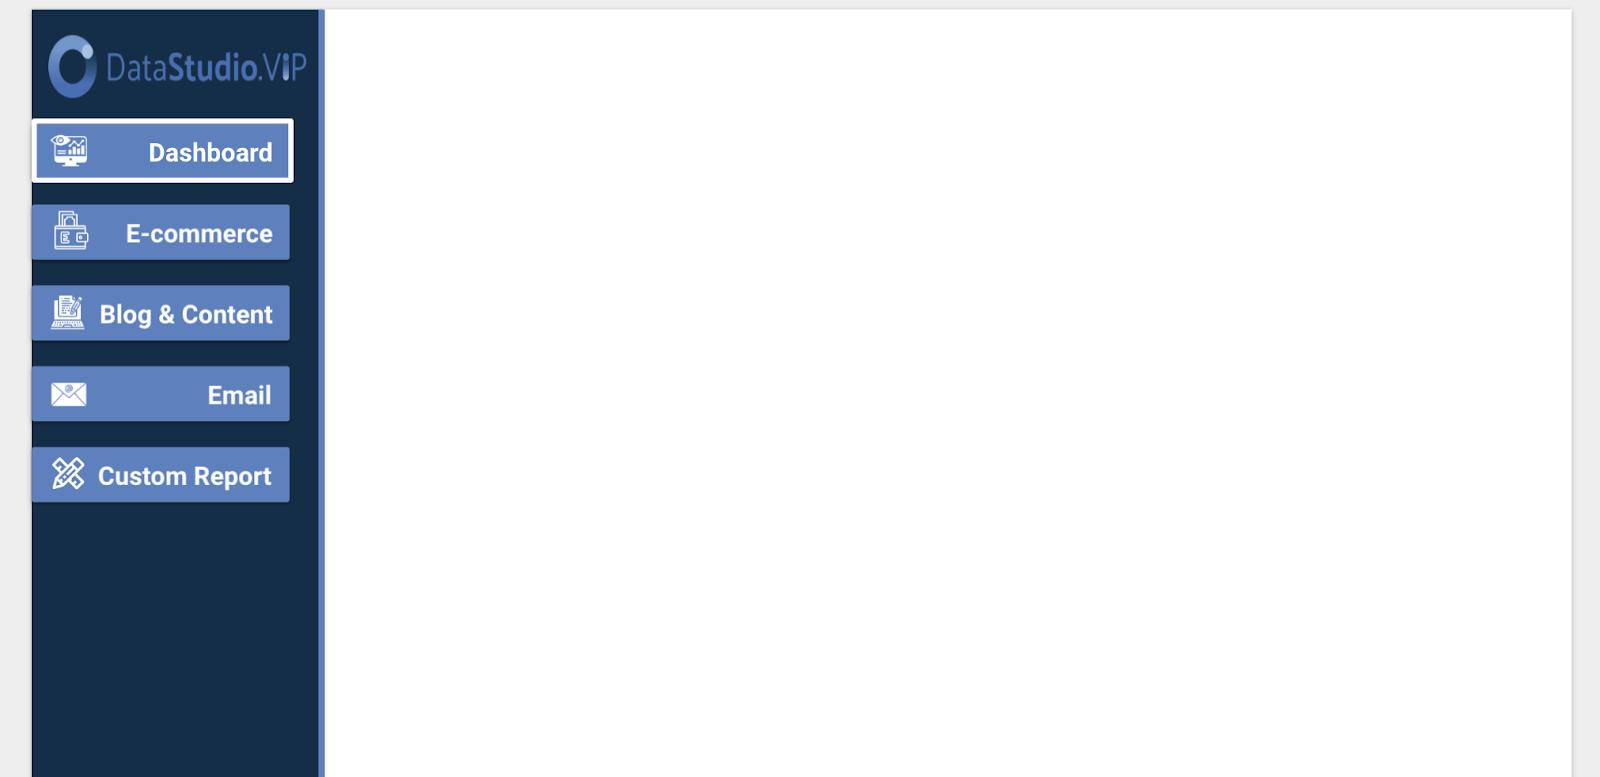
It should look something like this.
And TA-DA! Your dashboard navigation bar is complete!
This is a simple way to step up your visualizations and create aesthetically pleasing and easy-to-navigate dashboards.