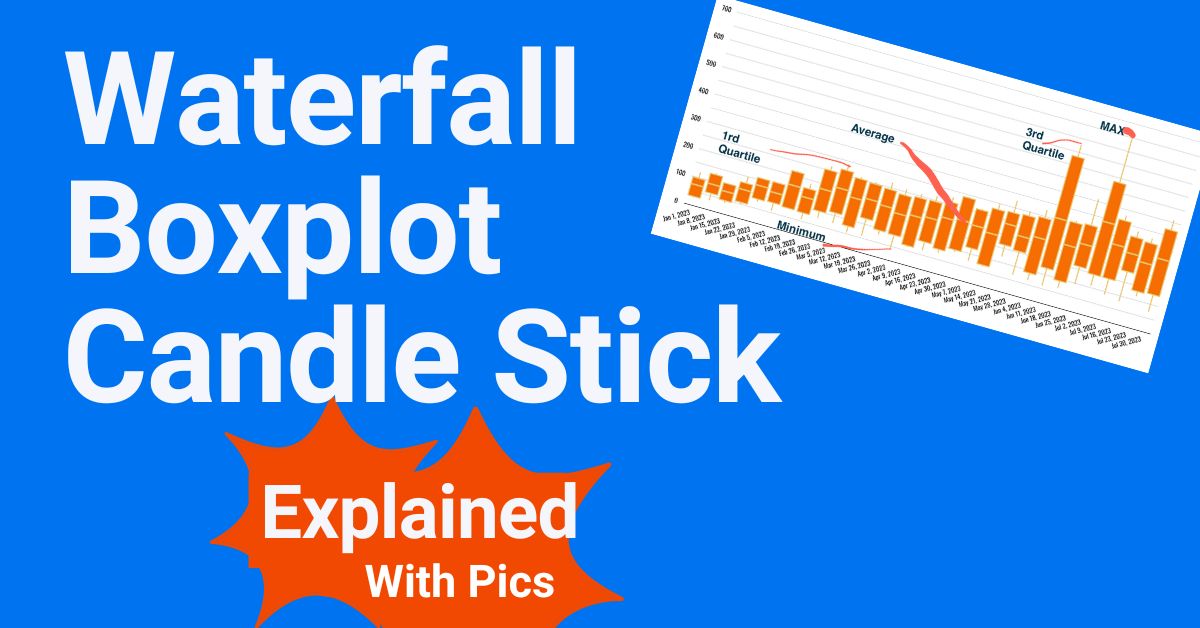
Box Plot, Candle Stick, and Waterfall Charts in Looker Studio Explained *with pics
Complex charts like Box plot, Candle Stick, & Waterfall require a little bit of preparation to build reliable & useful reports. This is how we do this.
Complex charts like Box plot, Candle Stick, & Waterfall require a little bit of preparation to build reliable & useful reports. This is how we do this.
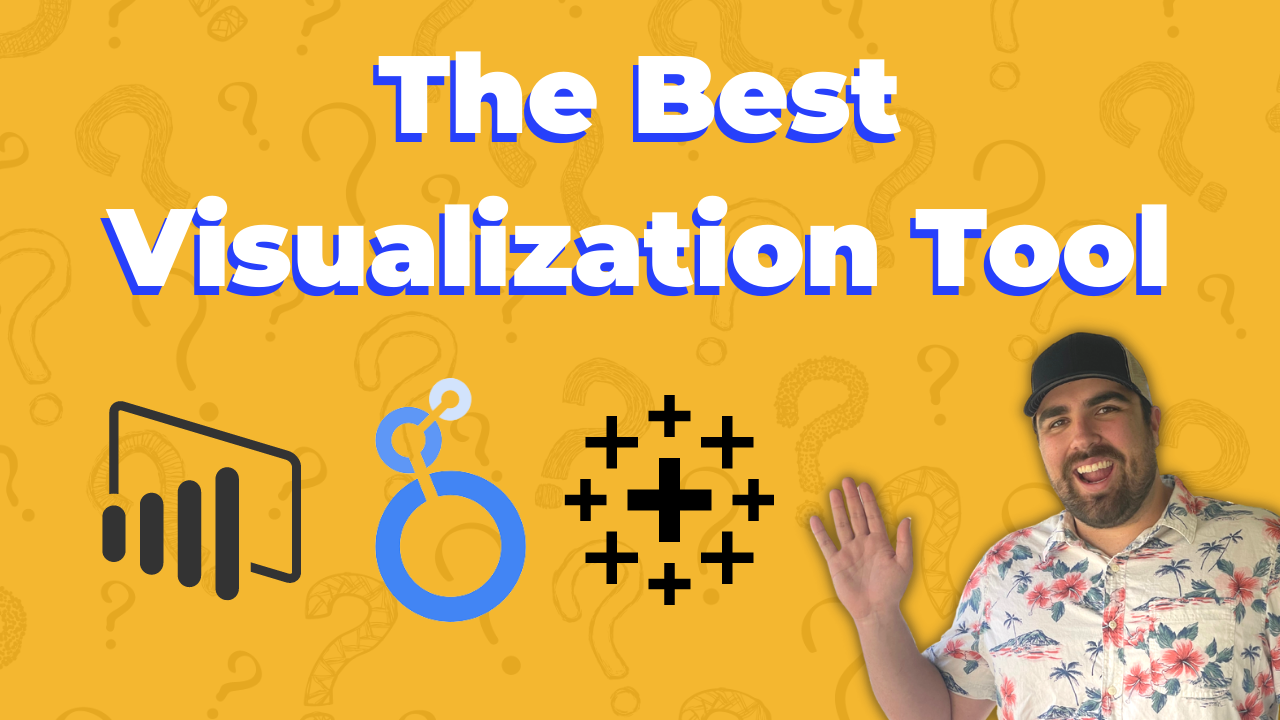
There are SO many visualization tools out there; how do you know which to use? Let us help!
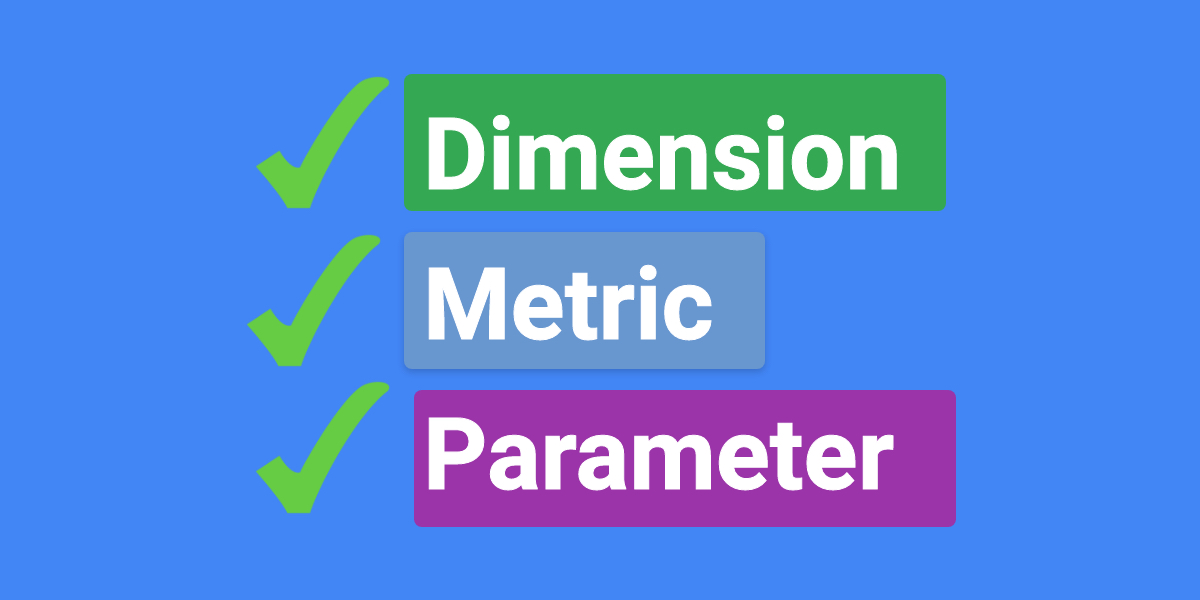
If you can understand these three fields within Looker Studio you will be able to surface any question & build any report using the numerous GDS functions available to us.